Pre-Lab Questions
1. What are the shells of most clams made of? Write out the name and chemical formula.
The shells are made up of calcium carbonate. It's chemical formula is caCO3.
2. What is the chemical formula for chitin?
(c8h13805n)
3. What is the chemical formula for vinegar? What is its chemical name?
(CH3COOH) acetic acid
4. What are some natural sources of carbon dioxide?
burning fossil fuels. Air from humans and animals.
5. What are some man-made sources of carbon dioxide?
burning of fossil fuels, And the industrial process for cement making.
6. How much carbon dioxide is released from volcanoes on average? 270 metric tons of carbon dioxide per year, 30,000 metric tonnes of carbon dioxide into the atmosphere per day. Give a time scale for your answer (ex. per year, per month, etc.).
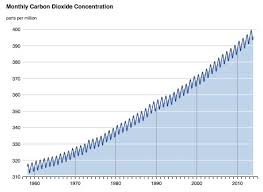
7. What is the Keeling Curve? What does it tell us about concentrations of carbon dioxide in the atmosphere?
The keeling curve is a graph that plots a ongoing change in carbon dioxide in the earths atmosphere. It tells us that the concentration constantly changes.
8. Draw a diagram of the Keeling Curve in your lab notebook. Include a time scale
1. What are the shells of most clams made of? Write out the name and chemical formula.
The shells are made up of calcium carbonate. It's chemical formula is caCO3.
2. What is the chemical formula for chitin?
(c8h13805n)
3. What is the chemical formula for vinegar? What is its chemical name?
(CH3COOH) acetic acid
4. What are some natural sources of carbon dioxide?
burning fossil fuels. Air from humans and animals.
5. What are some man-made sources of carbon dioxide?
burning of fossil fuels, And the industrial process for cement making.
6. How much carbon dioxide is released from volcanoes on average? 270 metric tons of carbon dioxide per year, 30,000 metric tonnes of carbon dioxide into the atmosphere per day. Give a time scale for your answer (ex. per year, per month, etc.).
7. What is the Keeling Curve? What does it tell us about concentrations of carbon dioxide in the atmosphere?
The keeling curve is a graph that plots a ongoing change in carbon dioxide in the earths atmosphere. It tells us that the concentration constantly changes.
8. Draw a diagram of the Keeling Curve in your lab notebook. Include a time scale
